

The number of Covid cases is falling slowly across Bracknell Forest – but there are still seven ‘hotspots’ areas.
A total of seven locations across the borough recorded case rates above 40 infections per 100,000 people.
The map colour-codes MSOAs depending on their seven-day rolling rate, with areas placed into the boundaries of 0-10, 11-50, 51-100, 101-200, 201-400, 400 to 799 and 800 plus.
Places with a high MSOA rates appear on the map in dark green (10-49) or blue (50 plus).
READ MORE: Bracknell's Miss England finalist reveals makeup free face to empower other women
The country is split up by Middle Super Output Area (MSOA), which are small areas with an average population of 7,200, and the data is updated every weekday, with the map showing the last seven days for which complete data is available.
In the seven days to March 9, 45 cases were recorded across the Bracknell Forest area.
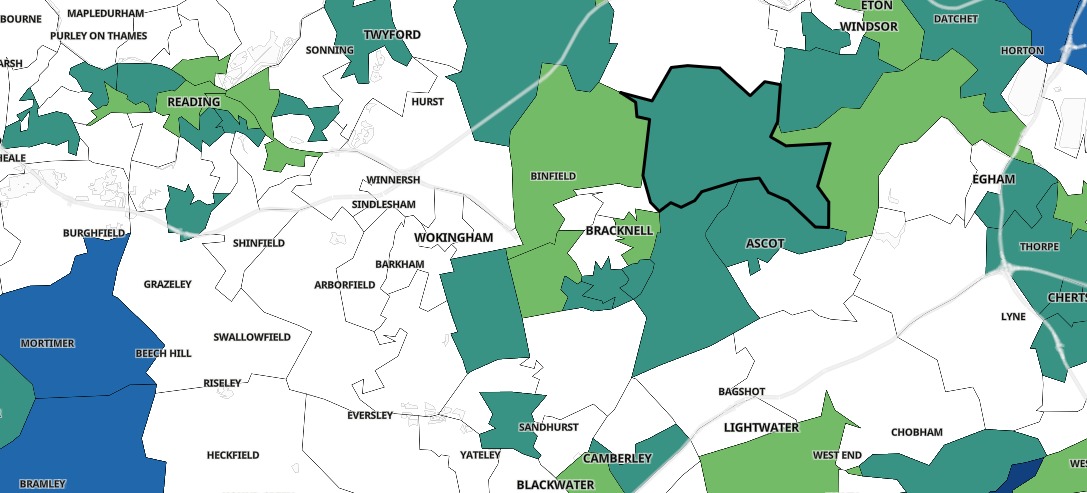
Covid map
The rate has also reduced to 38.4 in the last 24 hours.
ALSO READ: Blue's Smokehouse in Bracknell set to get big makeover
The areas with the highest case rates across the Bracknell Forest area:
- Sandhurst - 4 cases, (up by 2), rate 59.0
- Crowthorne North - 5 cases (up by 3), rate 62.0
- Hanworth West - 5 cases, (no difference), rate 73.2
- Birch Hill & Hanworth East - 6 cases, (down by 1), rate 81.2
- Crown Wood - 5 cases, (up by 3), rate 76.8
- Chavey Down & North Ascot West - 4 cases, (up by 2), rate 55.0
- Winkfield & Cranbourne - 3 cases, (up by 1), rate 51.2


Comments: Our rules
We want our comments to be a lively and valuable part of our community - a place where readers can debate and engage with the most important local issues. The ability to comment on our stories is a privilege, not a right, however, and that privilege may be withdrawn if it is abused or misused.
Please report any comments that break our rules.
Read the rules here